Interpreting Dot Plots
New Activity (No Rating Yet)
Activity Description
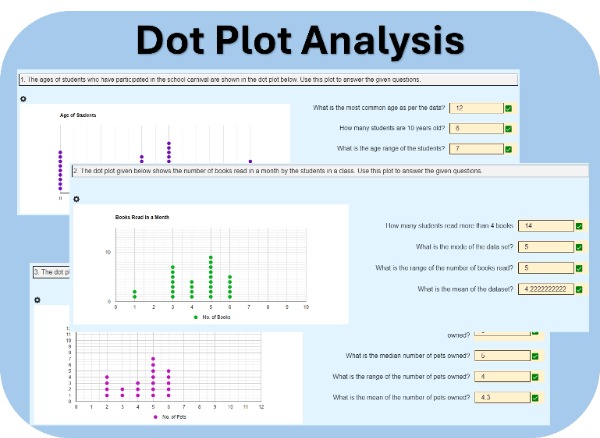
In this worksheet, students will engage in analyzing dot plots that represent real-world data scenarios. For example, one of the plots may show the ages of students who participated in a school carnival. Students will carefully examine these plots and answer a series of questions designed to deepen their understanding of data distribution and statistical measures.
Activity Overview:
- Real-World Data Analysis: Students will work with dot plots that depict real-life situations, such as age distributions at a school event. This helps students relate mathematical concepts to everyday experiences.
- Three Unique Sets of Data: Each student will be provided with three different dot plots, each accompanied by a set of questions.
- Answering Targeted Questions: Students will analyze the dot plots to answer questions related to the data.
Key Features:
- Auto-Graded: This interactive digital worksheet is auto-graded, eliminating the need for teachers to evaluate it manually, making it an excellent practice activity.
- Unique Questions: Each student will receive a unique set of 3 dot plots to promote individual practice and understanding.
- Re-Assignable: Re-assigning the worksheet to the same classroom will generate a new set of questions for each student.
Common Core Math -
Statistics & Probability
Summarize numerical data sets in relation to their context, such as by:
Common Core Math -
Statistics & Probability
Display numerical data in plots on a number line, including dot plots, histograms, and box plots.
Common Core Math -
Statistics & Probability
Understand that a set of data collected to answer a statistical question has a distribution which can be described by its center, spread, and overall shape.